Digital SAT practice

Reach your peak.

A quick run every day, an explanation for every question, and full-length tests on official timing.

See what’s free
Free, no card. You also get 36 practice questions a day: 12 easy, 12 medium and 12 hard.
The DailySTEP 1
  • Three hearts. A miss costs one.
  • Streaks pay. ×2 from three in a row, ×3 from six.
  • Your longest streak. Beat it tomorrow.

Full-length tests

The real test, rehearsed.

98 questions across four modules, in the digital SAT’s order and on its timing, with a highlighter, a question map and a timer you can see.
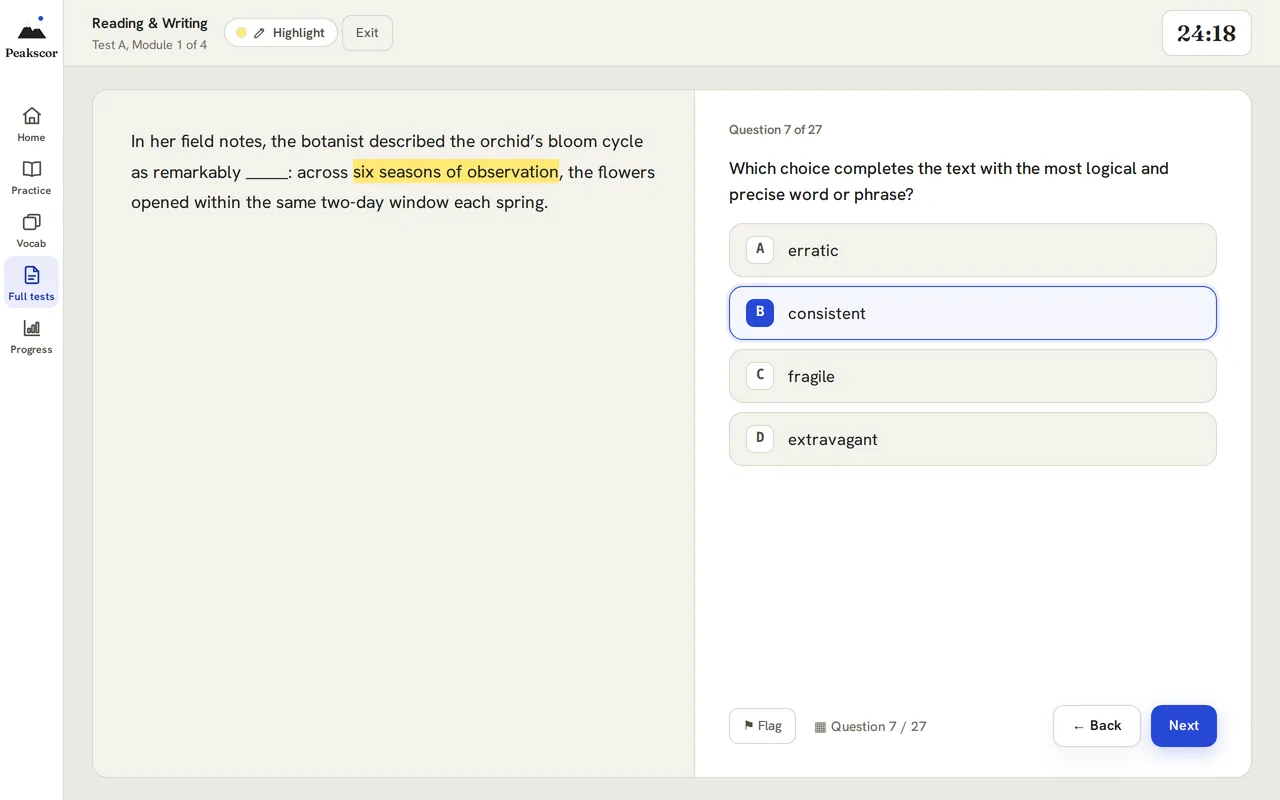
A Peakscor full-length test in progress: Reading and Writing, Test A, Module 1 of 4, question 7 of 27, with the passage, four answer choices, a highlighter, a 24:18 timer and Flag, Back and Next buttons.

How it works

One run a day. One skill at a time.

  1. 1

    Play the Daily.

    A quick run with three hearts. String right answers together and the questions get harder and the points multiply.

  2. 2

    Miss one, learn why.

    Every question is tagged by domain and skill, and every answer comes with an explanation.

  3. 3

    Drill that skill.

    Practice any single skill at any difficulty, or just the questions you got wrong.

  4. 4

    Beat your best.

    Come back tomorrow and climb. Progress shows your accuracy and your strongest skills.

Built around the real SAT blueprint.

Every question is tagged by section, domain, skill and difficulty, so you can practice exactly what you need. Full tests run like test day: two Reading & Writing modules, a break, then two Math modules.

Explanations

Every answer, explained.

Not just the right letter: how to get there, and why the tempting answer is wrong.

MathProblem-Solving and Data AnalysisHard

A store raises the price of a jacket by 20%. Later, it lowers the new price by 20%. The final price is what percent of the original price?

A80%
B96%Correct
C100%The trap
D104%

Check with $100: $100then$120then$96

  1. Turn each change into a multiplier.

    Up 20% means × 1.20. Down 20% means × 0.80.

  2. Apply them in order.

    1.20 × 0.80 = 0.96

  3. Read the answer.

    The final price is 96% of the original. That’s B.

  4. Why not 100%?

    The 20% cut is taken from the higher price, so it removes more than the 20% increase added.

Test day

What test day looks like.

Every Peakscor full test follows this order. In the standard tests, the second module of each section adapts to how you did on the first.

  1. Reading & Writing · Module 1

    27 questions32 min

  2. Reading & Writing · Module 2

    27 questions32 min

    Adapts to how you did on Module 1.
  3. Break

    10 min

  4. Math · Module 1

    22 questions35 min

  5. Math · Module 2

    22 questions35 min

    Adapts to how you did on Module 1.

98 questions · 2 hr 14 min of testing, plus the break

Peakscor by the numbers

  • 36free practice questions every day
  • 98questions in every full-length test
  • 1,023SAT vocabulary words
  • 1.5×extended-time option on every test

Plans

Free every day. Pro when you’re serious.

The free plan is the real thing, not a trial. Pro removes the limits. Peak adds the full course and a plan to test day.

Free

$0no card needed

  • The Daily, every day
  • 36 practice questions a day, each with an explanation: 12 easy, 12 medium, 12 hard
  • Full-length Test A and Challenge Test 1
  • All 1,023 vocabulary words: browse, flashcards and quiz
Start free daily practice

Pro

$20a month, or $200 a year

  • Everything in Free
  • Unlimited practice, no daily limit
  • Every full-length test and Challenge test
See Pro

Peak

$29a month, or $280 a year

  • Everything in Pro
  • The full Learn course: every lesson and mastery quiz
  • Peak Plan, day by day to test day
See Peak

Prices in US dollars. Cancel anytime.

FAQ

Questions, answered.

The Daily, plus 36 practice questions every day: 12 easy, 12 medium and 12 hard, each with a full explanation. Full-length Test A, Challenge Test 1 and all 1,023 vocabulary words are free too. No card needed.

Pro is $20 a month or $200 a year: unlimited practice with no daily limit, plus every full-length test and Challenge test. Peak is $29 a month or $280 a year: everything in Pro, plus the full Learn course and Peak Plan. Cancel anytime from your account.

98 questions across four modules, in the digital SAT’s order: Reading & Writing Module 1 and Module 2 (27 questions each), a 10-minute break, then Math Module 1 and Module 2 (22 questions each). On official timing that’s 2 hr 14 min of testing. You get estimated section scores and a total at the end.

Yes. In the standard full-length tests, Module 2 of each section is the harder version if you get 60% or more of Module 1 right, and the easier version if you don’t. Challenge tests use the hardest material throughout.

Official timing, extended 1.5× time, or untimed, on every test, including the free ones. Extended time allows 48 minutes for each Reading & Writing module and about 52 for each Math module. Untimed removes the clock so you can focus on accuracy.

A quick run with three hearts. Each right answer builds your streak: the questions get harder as it grows, and your points multiply (×2 from three in a row, ×3 from six). A miss costs a heart and drops you back to easy. Best is your longest streak.

Every day at midnight. You get a fresh 12 easy, 12 medium and 12 hard.

No. Peakscor is an independent SAT practice tool, not affiliated with the College Board. Scores shown are estimates.

Your next point starts today.

Free, no card.

Command of Evidence (Quantitative) · Lesson 3

Reading bar charts and line graphs

Before you read any value from a graph, read its labels. The axis titles say what is measured and in what unit, the legend says which bar or line belongs to which group, and the gridlines set the scale. If the y-axis title says (hundreds), a value of 7 means 700.

In a bar chart, each bar's height is a value. Bars that share a color or pattern belong to the same group, and bars side by side above one label let you compare groups in that category. Read across from the top of a bar to the y-axis.

In a line graph, the x-axis is often time. Follow one line at a time. A line that goes up from left to right is increasing, and its highest point is its peak. At a plotted point where two lines meet, their values are equal; when two lines cross, the one that was lower becomes the higher one.

In the graph below, the print and online lines meet at week 3, where both equal 45 readers. Before week 3, print has more readers; after it, online does. The online line peaks at week 5, with 60 readers.

Check the scale before you compare heights. If the y-axis doesn't start at zero, a small difference can look large. Compare the numbers, not how tall the bars look.

Weekly readers of a school newsletter in print and online123450510152025303540455055606570WeekReadersPrintOnline
Weekly readers of a school newsletter in print and online Line graph. Print readers: 60 in week 1, 55 in week 2, 45 in week 3, 40 in week 4 and 30 in week 5. Online readers: 20 in week 1, 35 in week 2, 45 in week 3, 55 in week 4 and 60 in week 5.

Worked example Easy

Entomologist Kwame Asante counted butterfly species in four habitats in a nature reserve, including a forest edge, the strip where a meadow meets deep forest. He suggests that such boundaries can be especially rich in species, because butterflies there can use resources from both neighboring habitats. For example,
Butterfly species counted in four habitats024681012141618202224262830MeadowForest edgeDeep forestWetlandHabitatButterfly species
Butterfly species counted in four habitats Bar chart. Butterfly species counted: meadow, 18; forest edge, 26; deep forest, 8; wetland, 14.

Which choice most effectively uses data from the graph to complete the example?

  1. the meadow had 18 butterfly species, more than the wetland's 14 and more than twice the deep forest's 8.
  2. the forest edge had 26 butterfly species, more than either the meadow (18) or the deep forest (8).Answer
  3. the deep forest had 8 butterfly species, the fewest of the four habitats and under half the meadow's 18.
  4. the forest edge had 18 butterfly species, fewer than the meadow's 26.

How to solve it

  1. The claim is that a boundary habitat, the forest edge, can be especially rich in species. The best example compares the forest edge with the habitats on either side of it.
  2. Read each bar against the y-axis: meadow 18, forest edge 26, deep forest 8, wetland 14.
  3. Choice B compares the forest edge (26) with the meadow (18) and the deep forest (8), the two habitats it joins.

Why each choice is right or wrong

  • A. Incorrect. It's accurate (18 is more than 14 and more than 2 × 8 = 16), but it compares the meadow with other habitats, and none of them is the boundary habitat. The claim is about the forest edge.
  • B. Correct. The forest edge's bar reaches 26, higher than the bars for the two habitats it borders, the meadow (18) and the deep forest (8). That illustrates a boundary rich in species.
  • C. Incorrect. It's accurate (8 is the shortest bar, and 8 is less than half of 18), but it describes the deep forest and the meadow, not the boundary.
  • D. Incorrect. This swaps two bars: the forest edge reached 26 and the meadow 18. As written, it contradicts the claim.

Worked example Hard

When the Kessler light-rail line opened in 2017, it ran alongside an existing bus route. Transit analyst Inês Barros tracked weekday ridership on both. She reports that the light-rail line took several years to catch on but eventually became the more popular choice: 2021 was the first year in which it carried more weekday riders than the bus route did.
Average weekday riders on the Kessler light-rail line and bus route, 2017–202220172018201920202021202204812162024283236404448525660YearWeekday riders (thousands)Light railBus
Average weekday riders on the Kessler light-rail line and bus route, 2017–2022 Line graph, in thousands of weekday riders. Light rail: 12 in 2017, 20 in 2018, 32 in 2019, 40 in 2020, 48 in 2021 and 56 in 2022. Bus: 52 in 2017, 48 in 2018, 44 in 2019, 40 in 2020, 36 in 2021 and 32 in 2022.

Which choice most effectively uses data from the graph to support Barros's claim?

  1. In 2020, the light-rail line and the bus route each carried 40 thousand weekday riders.
  2. The light-rail line's weekday ridership rose every year, from 12 thousand in 2017 to 56 thousand in 2022.
  3. In 2021, the bus route carried 48 thousand weekday riders and the light-rail line carried 36 thousand.
  4. The light-rail line carried 40 thousand weekday riders in 2020, the same as the bus route, and 48 thousand in 2021, compared with the bus route's 36 thousand.Answer

How to solve it

  1. The claim has a time word: 2021 was the first year the light rail carried more riders than the bus. You need 2021 with the light rail above the bus, and evidence that it was not above the bus the year before.
  2. Use the legend to tell the lines apart. The light rail rises from 12 to 56 thousand; the bus falls from 52 to 32 thousand. They meet at 40 thousand in 2020.
  3. Choice D gives the tie in 2020 and the light rail's lead in 2021 (48 versus 36 thousand). Choice A gives only the tie, and choice C swaps the lines.

Why each choice is right or wrong

  • A. Incorrect. It's accurate, and 2020 is where the lines meet, but equal ridership is not more. On its own, this shows only a tie, not the year the light rail moved ahead.
  • B. Incorrect. It's accurate, but rising ridership alone doesn't compare the light rail with the bus, so it can't show when the light rail first carried more riders.
  • C. Incorrect. This reads the two lines backward. In 2021 the light rail carried 48 thousand weekday riders and the bus 36 thousand.
  • D. Correct. The lines meet at 40 thousand in 2020, so the light rail was not ahead that year, and in 2021 it is above the bus, 48 thousand to 36 thousand. The graph shows it below the bus from 2017 through 2019 and tied with it in 2020, so 2021 is the first year it carried more.

Trap The swapped lines or bars

When a graph shows two groups, a wrong choice often gives the right numbers attached to the wrong group. Before you trust a value, match the bar or line to the legend.

Trap A meeting point is a tie, not a lead

At a plotted point where two lines meet, their values are equal. If the claim says one group moved ahead or had more, that point alone doesn't show it; you need a point where one line is clearly above the other.

Your progress

How you’re doing across daily practice and full-length tests.

Practice

Choose a section, then practice a whole domain or drill a single skill.

Difficulty
Status
Session
Timing

Full-length tests

Each test mirrors the digital SAT: 98 questions across four modules, 2 hr 14 min on official timing.

A little harder than the real SAT. These tests can run slightly tougher than test day, which makes them good practice: if you can handle these, the real one should feel easier. No question appears in more than one test, Challenge Tests included.

Challenge Tests Hardest of the hardest

Same 98-question format, but every question is drawn from the toughest SAT material: Challenging-tier math throughout and the hardest reading.

Vocab

Study the classic SAT vocabulary list. Browse, flip flashcards, or quiz yourself.

Free every day. Pro when you're serious.

Practice free every day. Pro removes the limits. Peak adds the full course and a plan to test day.

FREE

$0forever
 
  • ✓ 12 easy + 12 medium + 12 hard daily
  • ✓ Practice by any SAT domain
  • ✓ Explanations on every question
  • ✓ Test A and Challenge Test 1
  • ✓ The first lesson of every Learn module

PRO

$200/ year
About $16.67 a month, save $40
  • ✓ Everything in Free
  • ✓ Unlimited daily practice
  • ✓ Every full-length and Challenge test
  • ✓ Every timing mode
Full course and plan

PEAK

$280/ year
About $23.33 a month, save $68
  • ✓ Everything in Pro
  • ✓ Every Learn lesson, summary and mastery quiz
  • ✓ Peak Plan: a day-by-day plan to test day
  • ✓ Cancel anytime

Prices in USD. Switch or cancel your plan at any time.

▦ Calculator
Drag the bar to move it, and the corner to resize it