Free
$0no card needed
- The Daily, every day
- 36 practice questions a day, each with an explanation: 12 easy, 12 medium, 12 hard
- Full-length Test A and Challenge Test 1
- All 1,023 vocabulary words: browse, flashcards and quiz
Reach your peak.
A quick run every day, an explanation for every question, and full-length tests on official timing.
Full-length tests
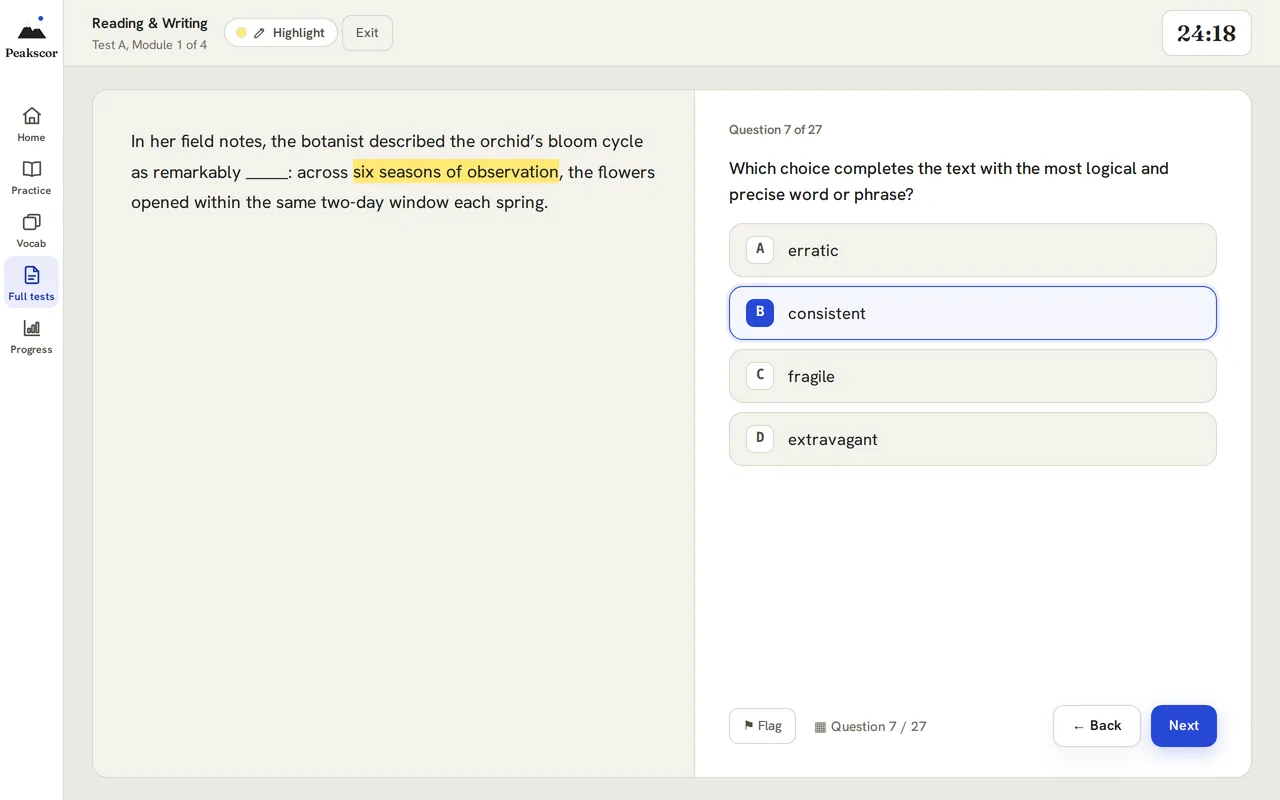
98 questions across four modules, in the digital SAT’s order and on its timing, with a highlighter, a question map and a timer you can see.
How it works
A quick run with three hearts. String right answers together and the questions get harder and the points multiply.
Every question is tagged by domain and skill, and every answer comes with an explanation.
Practice any single skill at any difficulty, or just the questions you got wrong.
Come back tomorrow and climb. Progress shows your accuracy and your strongest skills.
Every question is tagged by section, domain, skill and difficulty, so you can practice exactly what you need. Full tests run like test day: two Reading & Writing modules, a break, then two Math modules.
12 easy, 12 medium and 12 hard questions free every day, each with a full explanation. Filter by section, domain, skill and difficulty. Resets at midnight.
Take any test on official timing, extended 1.5× time, or untimed to focus purely on accuracy.
Four modules in official order. The second module of each section adapts to how you did on the first.
1,023 essential SAT words. Browse the list, flip flashcards, or quiz yourself.
Accuracy across daily practice and full tests, your strongest skills, and the ones that need the most help.
PEAK Survivor, Hole and Peak Defense: three games powered by SAT practice questions.
Explanations
Not just the right letter: how to get there, and why the tempting answer is wrong.
A store raises the price of a jacket by 20%. Later, it lowers the new price by 20%. The final price is what percent of the original price?
Check with $100: $100→then$120→then$96
Up 20% means × 1.20. Down 20% means × 0.80.
1.20 × 0.80 = 0.96
The final price is 96% of the original. That’s B.
The 20% cut is taken from the higher price, so it removes more than the 20% increase added.
Test day
Every Peakscor full test follows this order. In the standard tests, the second module of each section adapts to how you did on the first.
27 questions32 min
27 questions32 min
10 min
22 questions35 min
22 questions35 min
98 questions · 2 hr 14 min of testing, plus the break
Plans
The free plan is the real thing, not a trial. Pro removes the limits. Peak adds the full course and a plan to test day.
$0no card needed
$20a month, or $200 a year
$29a month, or $280 a year
Prices in US dollars. Cancel anytime.
FAQ
The Daily, plus 36 practice questions every day: 12 easy, 12 medium and 12 hard, each with a full explanation. Full-length Test A, Challenge Test 1 and all 1,023 vocabulary words are free too. No card needed.
Pro is $20 a month or $200 a year: unlimited practice with no daily limit, plus every full-length test and Challenge test. Peak is $29 a month or $280 a year: everything in Pro, plus the full Learn course and Peak Plan. Cancel anytime from your account.
98 questions across four modules, in the digital SAT’s order: Reading & Writing Module 1 and Module 2 (27 questions each), a 10-minute break, then Math Module 1 and Module 2 (22 questions each). On official timing that’s 2 hr 14 min of testing. You get estimated section scores and a total at the end.
Yes. In the standard full-length tests, Module 2 of each section is the harder version if you get 60% or more of Module 1 right, and the easier version if you don’t. Challenge tests use the hardest material throughout.
Official timing, extended 1.5× time, or untimed, on every test, including the free ones. Extended time allows 48 minutes for each Reading & Writing module and about 52 for each Math module. Untimed removes the clock so you can focus on accuracy.
A quick run with three hearts. Each right answer builds your streak: the questions get harder as it grows, and your points multiply (×2 from three in a row, ×3 from six). A miss costs a heart and drops you back to easy. Best is your longest streak.
Every day at midnight. You get a fresh 12 easy, 12 medium and 12 hard.
No. Peakscor is an independent SAT practice tool, not affiliated with the College Board. Scores shown are estimates.
Free, no card.
Two-variable data · Lesson 2
A line of best fit is a straight line drawn through the middle of a linear scatterplot. It models the data: for any -value, it gives a predicted -value. The SAT usually gives you the line, drawn on the graph or as an equation such as .
Predicting. To predict for a given , substitute into the equation, or go up from to the line (not to a dot) and across to the -axis. A dot is an actual value. The line gives the predicted value.
Slope. The slope is the *predicted change in for each increase of 1 in *. If is a weight in kilograms and is a price in dollars, a slope of 2.4 means the price is predicted to rise 2.4 dollars for each additional kilogram. It is a per-unit change, not a total, and it describes the model, not exactly what happens for each individual.
**-intercept.** The -intercept, 15 here, is the predicted -value when . When is far outside the data, that prediction is unreliable, and when makes no sense in context, it has no real-world meaning.
Actual versus predicted. For one data point, actual minus predicted is called the residual. A dot above the line has an actual value greater than predicted (positive residual). A dot below the line has an actual value less than predicted (negative residual).
Predictions far outside the range of the data are less trustworthy, because the trend may not continue.
Based on the line of best fit, what is the predicted quiz score for a student who studied 6 hours?
Which statement is the best interpretation of the slope of the line of best fit in this context?
When a question says based on the line of best fit, the answer comes from the line. A dot at that -value is an actual data value, and the SAT often lists it as a choice.
The slope is the change for one unit of . For an increase of 10 units, the predicted change is 10 times the slope. The -intercept never enters a difference between two predictions, because it is in both and cancels.
Residual means actual minus predicted: positive for a dot above the line, negative for a dot below it. A choice with the right size and the wrong sign is a common trap.
When the line is given as an equation, type it as a function, such as , and on the next line type . Desmos shows the predicted value, 29.4.
To go backward (which gives a predicted of 27?), graph and and click the point where they cross. Its -coordinate, 5, is the answer.
If a question gives raw data in a table, add a table in Desmos, type the values in the and columns, and on a new line type . Desmos fits the line and shows the values of and .
For one-step predictions with clean numbers, mental math is just as fast.
Choose a section, then practice a whole domain or drill a single skill.
Each test mirrors the digital SAT: 98 questions across four modules, 2 hr 14 min on official timing.
Same 98-question format, but every question is drawn from the toughest SAT material: Challenging-tier math throughout and the hardest reading.
Study the classic SAT vocabulary list. Browse, flip flashcards, or quiz yourself.
Practice free every day. Pro removes the limits. Peak adds the full course and a plan to test day.
Prices in USD. Switch or cancel your plan at any time.
Online payment hasn’t launched, so nothing here asks for a card. Everything on the free plan stays free.
Save your progress and pick up where you left off.
Your account keeps game coins, characters and map progress in sync across devices. Practice history stays on this device.